
POC*Explorer
Patterns of Care Explorer Help
Patterns of Care Explorer (POC*Explorer) is an interactive tool for quick access to aggregate, de-identified data from certain POC studies. Data may be viewed as graphs or tables and downloaded.
POC*Explorer allows for direct comparison of one characteristic at a time (such as Race/Ethnicity or Sex) for three selected groups: clinical trial registration, mutation testing, and use of systemic therapies. For example, you can compare systemic therapy use (overall or by specific agent/regimen) by Race/Ethnicity.
Using Patterns of Care Explorer
Quick Start Guide
The following steps provide an overview on how to use the Patterns of Care Explorer application.
- In the upper left, select a cancer site using the Get Started with a Cancer Site dropdown list.
- Select from the list or in the first field of the list begin typing a cancer site name to see the available sites that match your term.
- In the upper right, select a year of diagnosis using the Choose a Year of Diagnosis dropdown list.
- POC*Explorer currently allows selection of data from 2010, 2015, or 2010 and 2015 combined.
- Select a category of data to display by clicking on the tab.
- Four categories of data can be examined in POC*Explorer: Demographics, Clinical Trials, Mutation Testing, and Use of Treatment Agents.
- Demographics data are unweighted counts; other data categories are presented as weighted percents.
- Demographics data are presented only as data tables; other data categories can be presented as tables or graphs.
- Select a Compare By variable tab.
- For all data categories, you can select Sex, Race/Ethnicity, Age, or Insurance Status to compare by. Multiple variable values can be selected for the primary variable. For example, when comparing by sex you can select one or more of the choices which are Both Sexes (combined), Female, and Male.
- For Demographics, Treatment Agents is also a Compare By variable. This Compare By variable includes Any Systemic Agent and/or one or more of the listed agents/regimens.
- For Clinical Trials and Mutation Testing, Year of Diagnosis is also a Compare By variable.
- For Use of Treatment Agents, both Year of Diagnosis and Treatment Agents are Compare By variables.
Interface Details
- "Mousing over" columns in graphs provides details of the column values
- Graphs include a Graph Display option "Show Compare By Variable as the legend". For example, in the graph of Clinical Trials with Compare By Sex, there is a Graph Display option "Show Sex as the legend". In this example, if this box is selected, the graph change from the weighted percents of individuals not registered or registered in clinical trials by sex to the weighted percents of females and males by clinical trial registration status. That is, the Compare By variable is presented as a weighted proportion in the graph y-axis rather than a category along the graph x-axis.
- More Options: selecting this box (on the left side of the screen, below Compare By) shows 95% Confidence Intervals for weighted percents in both Graphs and Data Tables. This Option is not available for Demographics, which presents unweighted counts.
Export Options
There are three options for exporting data from POC*Explorer. There are accessed by the icons on the right side of the screen:

The first icon is Download Graph. This permits downloading an image file (.PNG) of the currently displayed graph. Selecting this icon opens a window with options for the downloaded image file:
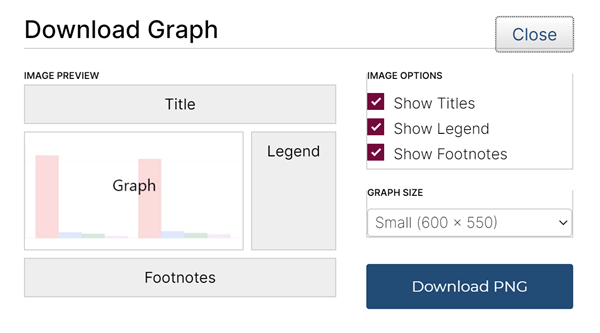
The options for the downloaded image file are inclusion of the graph title, legend, and/or footnotes and selection of the graph size (small, medium, or large). Note that this download option is NOT available when displaying Demographics data since a Graph display is not available for Demographics.
The second download option  is Download Data. This permits downloading an Excel®-compatible comma-separated value (CSV) file of the data currently being examined. Selecting this icon opens a window with options for selecting a name and directory location for this file.
The third download option  is Copy Link. This copies a web link (URL) for the current POC*Explorer data display to the computer’s clipboard. This link can then be pasted in to emails, documents, or other sources to allow shared access to a specific POC*Explorer data display.
Frequently Asked Questions
- Where do I go for Technical Support?
Please send questions or comments to POC*Explorer Feedback/Support..
Acknowledgements
Data presented in POC*Explorer are provided by the National Cancer Institute’s Patterns of Care studies. These data were developed through the efforts of the NCI Healthcare Delivery Research Program and the Surveillance, Epidemiology, and End Results (SEER) Program tumor registries.