The SEER-Medicare Condensed Resource (CoRe) Enrollment file includes one record for each cancer diagnosis reported to SEER that occurred among persons enrolled in Medicare. The file can be used to identify analytic cohorts based on continuous Medicare enrollment relative in time to the date of cancer diagnosis. Requiring continuous enrollment ensures as complete as possible healthcare utilization and outcomes data. The enrollment file combines information from the annual Medicare Master Beneficiary Summary File (MBSF) (aka the Medicare BASE enrollment file) and the SEER-Medicare Cancer File.
Historically, most SEER-Medicare analyses have been restricted to elderly persons (i.e., age >65 years) who have continuous enrollment in Parts A (in-patient) and B (out-patient) fee-for-service (ABFFS) prior to a malignant cancer diagnosis to assess pre-diagnosis comorbidities and to persons who have continuous ABFFS and/or Part D (prescription drug) coverage after diagnosis to assess receipt of cancer treatment. With the release of Medicare Advantage (MA) encounter data, the assessment of healthcare utilization among persons enrolled in Medicare managed care plans can also be assessed. Therefore, the CoRe enrollment file indicates ABFFS or Part D cohort inclusion for each cancer diagnosis.
Cohort observation time can end (“cohort exit”) in month 2+ after diagnosis for multiple reasons (e.g., Medicare enrollment status changed, the person died, the person was diagnosed with a subsequent malignant cancer, or end of available data). The end observation date and reason for end of observation is also documented in the Enrollment file.
If a person has more than one cancer diagnosis, they will have more than one record in the Enrollment file, to provide enrollment information relative to each cancer diagnosis. Additional records will include enrollment data at and around any subsequent cancer diagnosis; therefore, the last chronological record for each person will list either the date they died or the end of available data, which will change each time the linkage is updated. The below figure illustrates four scenarios of how Medicare enrollment relative to cancer diagnosis relates to cohort inclusion and available measures.
Scenarios illustrating the relationship between Medicare enrollment relative to cancer diagnosis, cohort inclusion, and available measures
Click image to expand for more detail
Scenarios illustrating the relationship between Medicare enrollment relative to cancer diagnosis, cohort inclusion, and available measures.
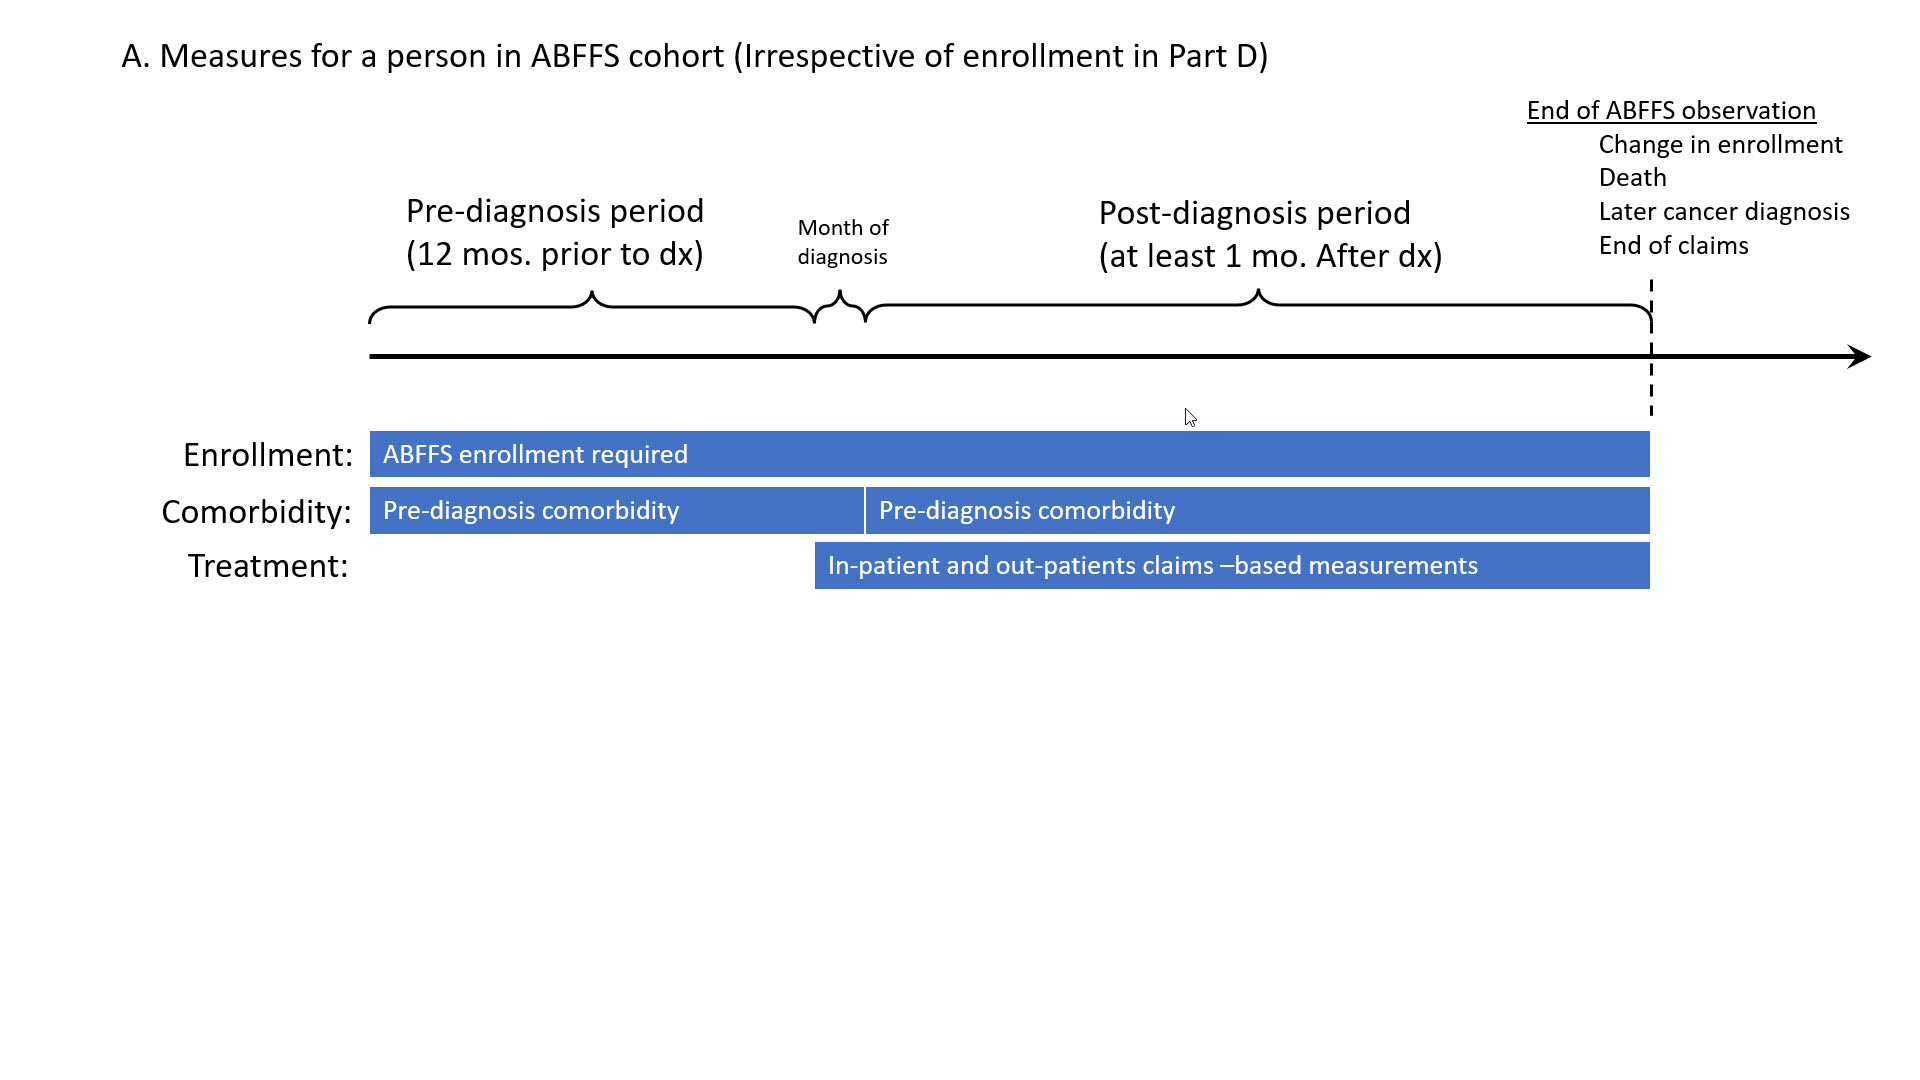
A. Measures for a person in ABFFS cohort (Irrespective of enrollment in Part D).
This illustrates the observed timeline and available measures for a person who has only one known cancer diagnosis and is included in the ABFFS cohort, but not in the Part D cohort. ABFFS cohort inclusion requires enrollment in Medicare fee-for-service Parts A and B during a continuous 12-month baseline pre-diagnosis period, the month of diagnosis, and at least one month post diagnosis. In this specific example, the person is included in the cohort for more than 12 months post diagnosis. Therefore, this person will have available claims to determine pre- and post-diagnosis comorbidities, and in-patient and out-patient cancer treatments starting from 4 months prior to their diagnosis through the end of ABFFS cohort observation. Cohorts are designed to allow for treatment assessments prior to diagnosis to acknowledge possible diagnosis date imprecision. Here, cohort observation may have ended due to changes in enrollment, such as dropping Part A and/or B coverage or switching to Medicare Advantage (HMO); death; or end of available data.
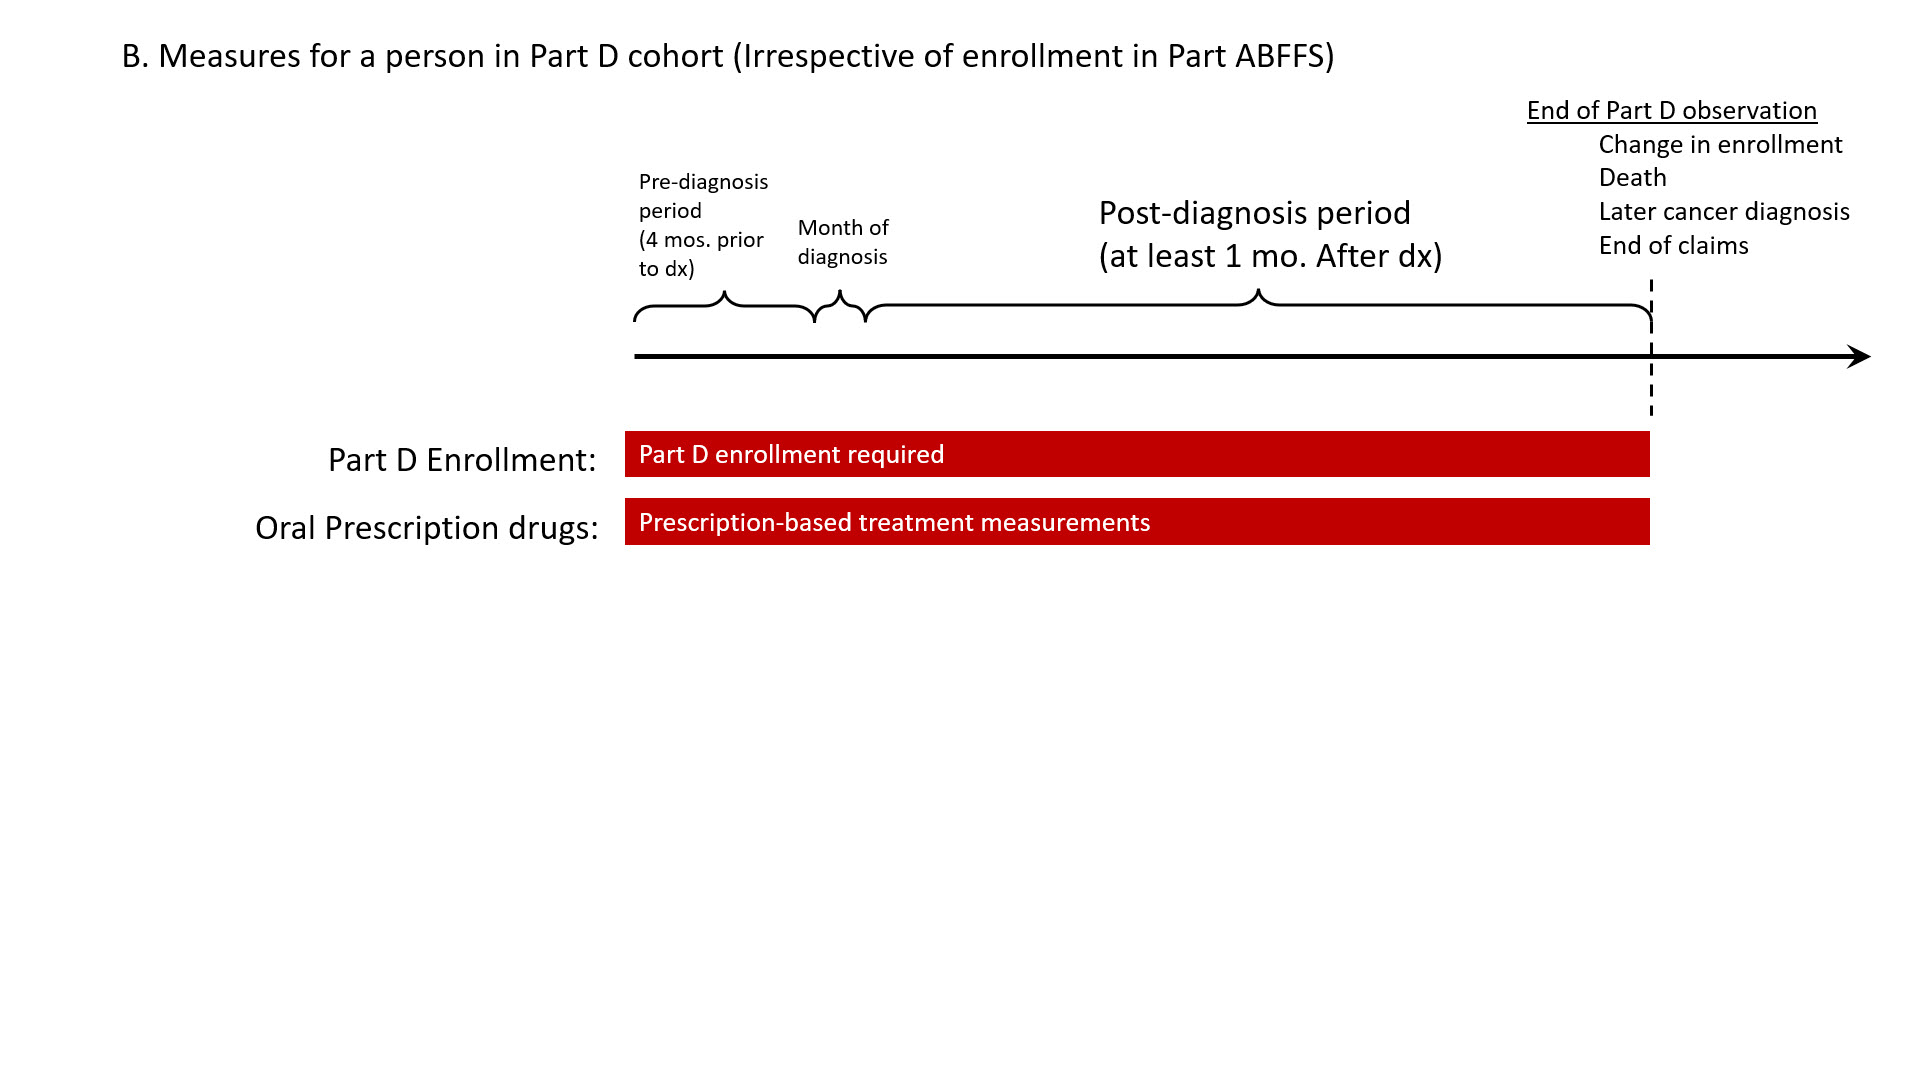
B. Measures for a person in Part D cohort (Irrespective of enrollment in Part ABFFS).
This illustrates the observed timeline and available measures for a person who has only one known cancer diagnosis and is included in the Part D cohort, but not in the ABFFS cohort. Part D cohort inclusion requires enrollment in Medicare Part D during a continuous 4-month baseline pre-diagnosis period, the month of diagnosis, and at least one month post diagnosis. In this specific example, the person is included in the cohort for more than 12 months post diagnosis. Therefore, this person will have available prescription data to determine their pharmacy-based cancer treatments starting from 4 months prior to their diagnosis date through the end of Part D cohort observation. Cohorts were designed to allow for treatment assessments prior to diagnosis to acknowledge possible diagnosis date imprecision. Here, cohort observation may have ended due to end of Part D coverage; death; or end of available data.
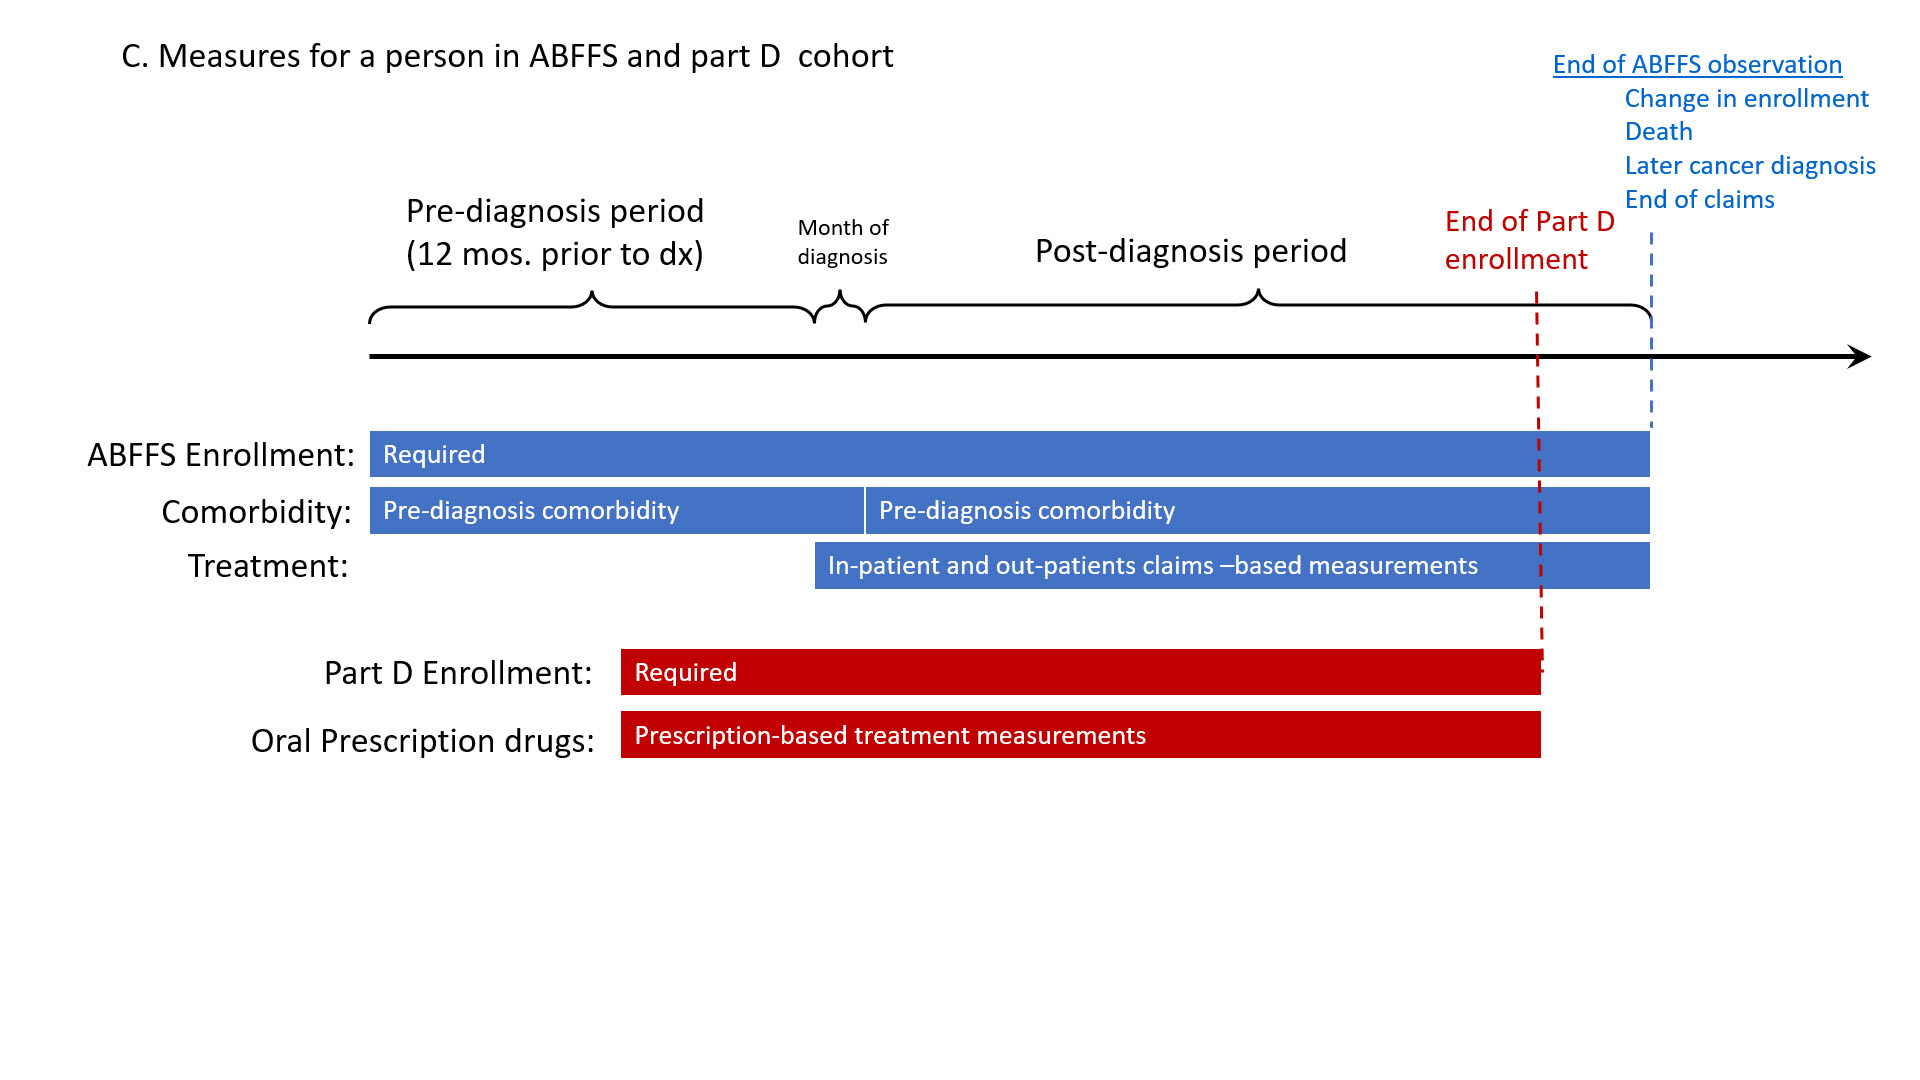
C. Measures for a person in ABFFS and part D cohort.
This illustrates the observed timeline and available measures for a person who has only one known cancer diagnosis and is included in both the ABFFS and Part D cohorts. ABFFS cohort inclusion requires enrollment in Medicare fee-for-service Parts A and B during a continuous 12-month baseline pre-diagnosis period, the month of diagnosis, and at least one month post diagnosis. Part D cohort inclusion requires enrollment in Medicare Part D a continuous 4-month baseline pre-diagnosis period, the month of diagnosis, and at least one month post diagnosis. In this specific example, the person stays in the ABFFS cohort for more than 12 months post diagnosis but drops their Part D coverage before their ABFFS cohort observation ends. This person will have available claims to determine pre- and post-diagnosis comorbidities and sufficient information to determine their in-patient, out-patient, and pharmacy-based cancer treatments starting from 4 months prior to their diagnosis date through end of cohort observation. Cohorts were designed to allow for treatment assessments prior to diagnosis to acknowledge possible diagnosis date imprecision. In this example, pharmacy-based cancer treatments will be observable until the person dropped their Part D coverage and in-patient and out-patient cancer treatments will be observable through the end of ABFFS cohort observation, which here may have ended due to changes in enrollment, such as dropping Part A and/or B coverage or switching to Medicare Advantage (HMO); death; or end of available data.
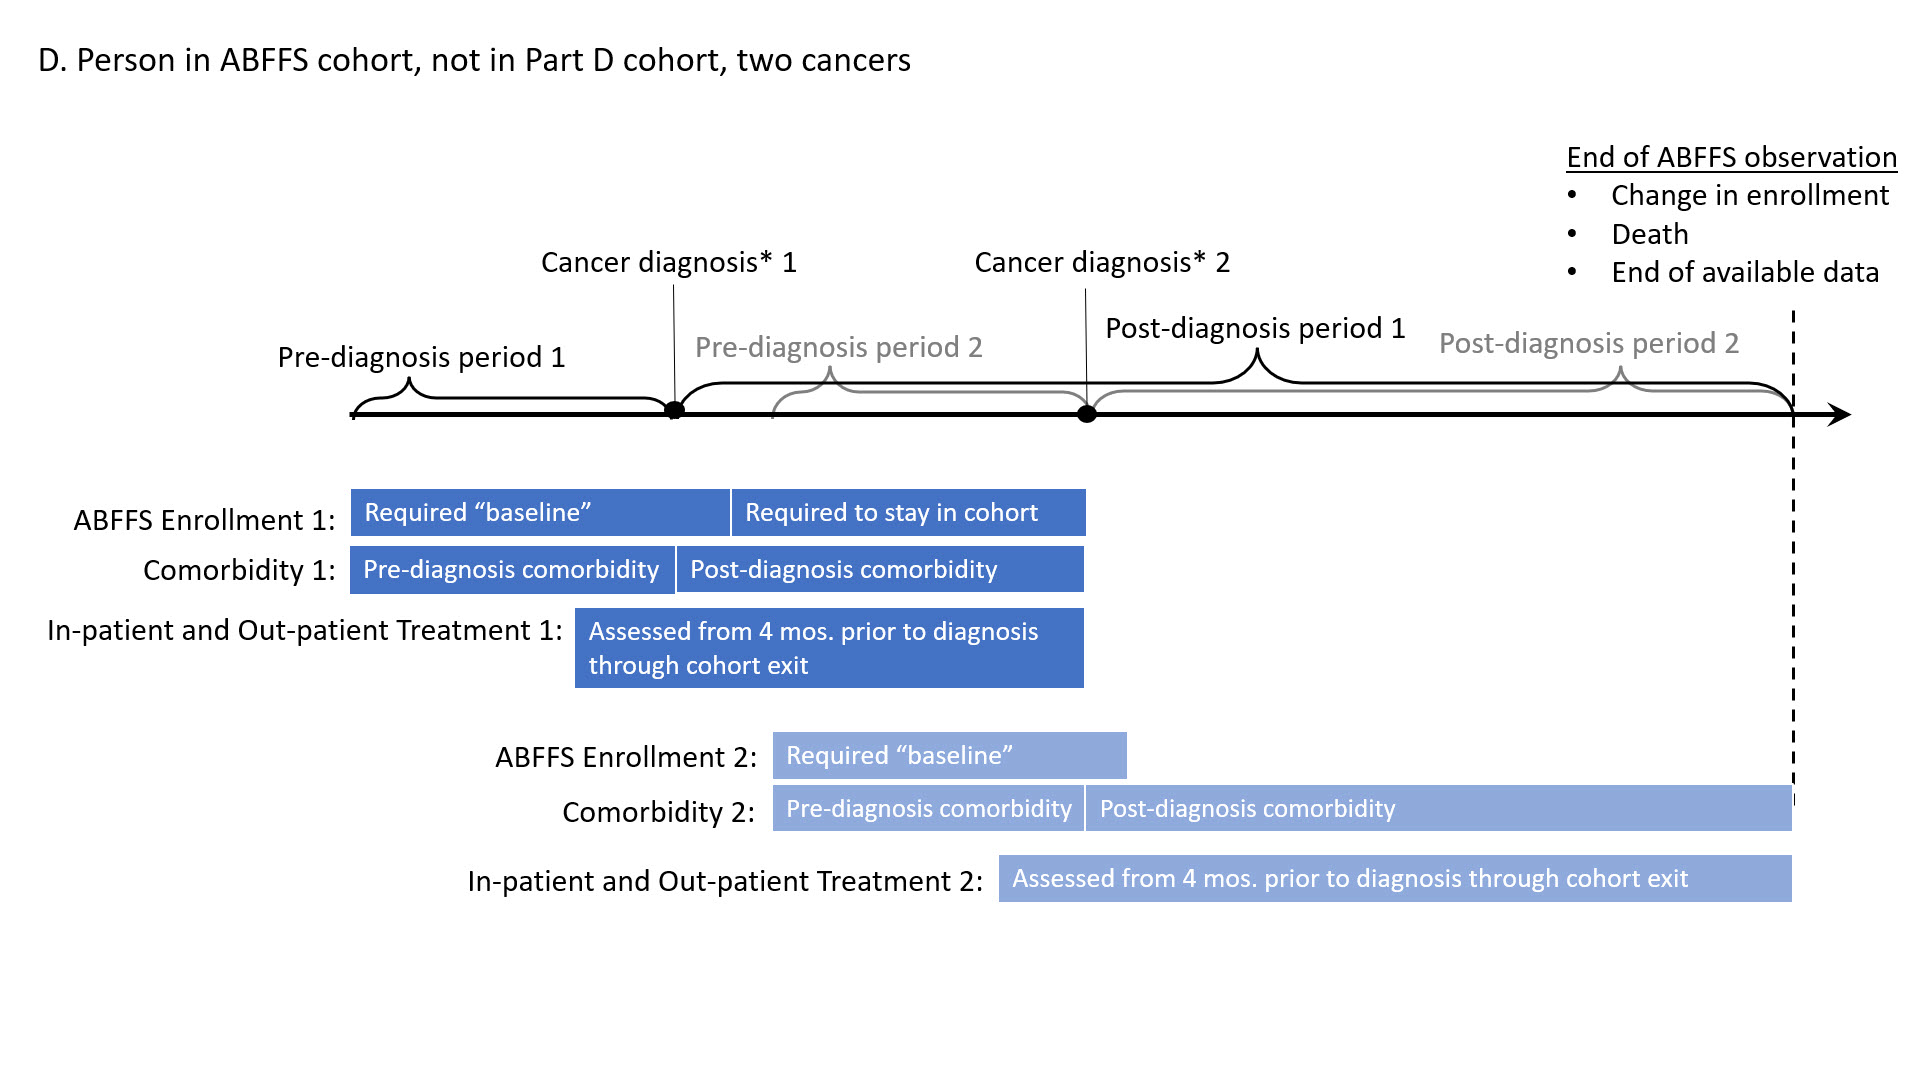
D. Measures for a person in ABFFS cohort only, not in Part D cohort, two cancers.
This illustrates the observed timeline and available measures for a person who has two known cancer diagnoses. Cohort inclusion is determined at the tumor-level. Therefore, in this example, the person’s two tumors were both included in the ABFFS cohort, but not the Part D cohort. ABFFS cohort inclusion requires enrollment in Medicare fee-for-service Parts A and B during a continuous 12-month baseline pre-diagnosis period, the month of diagnosis, and at least one month post diagnosis. As a result, this person will have available claims to determine comorbidities during the pre- and post-diagnosis periods for both tumors and sufficient information to determine their in-patient and out-patient cancer treatments starting from 4 months prior to each diagnosis date through end of cohort observation for each tumor. Cohorts were designed to allow for treatment assessments prior to diagnosis to acknowledge possible diagnosis date imprecision. In this example, ABFFS cohort observation for tumor 1 ends at tumor 2 diagnosis and ABFFS cohort observation for tumor 2 may have ended due to changes in enrollment, such as dropping Part A and/or B coverage or switching to Medicare Advantage (HMO); death; or end of available data. Note that the post-diagnosis observation period for tumor 1 overlaps with the pre-diagnosis observation period for tumor 2.
SEER-Medicare cancer diagnoses at age 66+ years by cohort inclusion status
Cancer diagnoses that do not meet the ABFFS or Part D cohort inclusion criteria are included in the CoRe Enrollment file, to allow assessments of representativeness. The file includes variables that document reason for ABFFS and/or Part D cohort exclusion (i.e., in hierarchical order: diagnosed prior to 2000 for ABFFS or 2008 for Part D; unknown month of diagnosis; age at diagnosis <66 years or unknown age; non-malignant cancer diagnosis or malignancy status unknown; diagnosis at death/autopsy; and non-continuous enrollment during the baseline period: 12 months prior to through one month after cancer diagnosis). Cancer diagnoses included in the ABFFS cohort without any claims during the 12 months prior to diagnosis are also flagged.
The below tables provide a comparison of person-level demographics and tumor characteristics for the cancers included in the ABFFS cohort, the Part D cohort, both the ABFFS and Part D cohorts, which is not mutually exclusive from the two prior categories, and those in neither cohort, which largely consists of Medicare Advantage beneficiaries. Persons with more than one eligible cancer will be represented more than once and could be included in more than one category because cohort inclusion is assessed with respect to each cancer diagnosis.